Basic PEMtk fitting class demo
01/09/22
Outline of this notebook:
Load required packages.
Setup pemtkFit object.
Set various parameters, either from existing data or new values.
Data is handled as a set of dictionaries within the class,
self.data[key][dataType], wherekeyis an arbitrary label for, e.g. a specific experiment, calculation etc, anddataTypecontains a set of values, parameters etc. (Should become clear below!)Methods operate on all
self.dataitems in general, with some special cases:self.data['subset']contains data to be used in fitting.
Simulate data
Use ePSproc to simulated aligned-frame measurements.
Fit data (serial version)
For batch and parallel fitting see the multi-fit demo notebook
Prerequisities
Working installation of ePSproc + PEMtk (or local copies of the Git repos, which can be pointed at for setup below).
Test/demo data, from ePSproc Github repo.
Setup
Imports
A few standard imports…
[1]:
import sys
import os
from pathlib import Path
# import numpy as np
# import epsproc as ep
# import xarray as xr
from datetime import datetime as dt
timeString = dt.now()
And local module imports. This should work either for installed versions (e.g. via pip install), or for test code via setting the base path below to point at your local copies.
[2]:
# For module testing, include path to module here, otherwise use global installation
if sys.platform == "win32":
modPath = Path(r'D:\code\github') # Win test machine
winFlag = True
else:
modPath = Path(r'/home/femtolab/github') # Linux test machine
winFlag = False
# Append to sys path
sys.path.append((modPath/'ePSproc').as_posix())
sys.path.append((modPath/'PEMtk').as_posix())
[3]:
# ePSproc
import epsproc as ep
# Set data path
# Note this is set here from ep.__path__, but may not be correct in all cases - depends on where the Github repo is.
epDemoDataPath = Path(ep.__path__[0]).parent/'data'
* Setting plotter defaults with epsproc.basicPlotters.setPlotters(). Run directly to modify, or change options in local env.


* Set Holoviews with bokeh.
[4]:
# PEMtk
# import pemtk as pm
# from pemtk.data.dataClasses import dataClass
# Import fitting class
from pemtk.fit.fitClass import pemtkFit

C:\Users\femtolab\.conda\envs\ePSdev\lib\site-packages\xyzpy\plot\xyz_cmaps.py:6: MatplotlibDeprecationWarning:
The revcmap function was deprecated in Matplotlib 3.2 and will be removed two minor releases later. Use Colormap.reversed() instead.
return LinearSegmentedColormap(name, cm.revcmap(cmap._segmentdata))
[5]:
# Set HTML output style for Xarray in notebooks (optional), may also depend on version of Jupyter notebook or lab, or Xr
# See http://xarray.pydata.org/en/stable/generated/xarray.set_options.html
# if isnotebook():
# xr.set_options(display_style = 'html')
[6]:
# Set some plot options
ep.plot.hvPlotters.setPlotters()
* Set Holoviews with bokeh.
Set & load parameters
There are a few things that need to be configured for a given case…
Matrix elements (or (l,m,mu) indicies) to use.
Alignment distribution (ADMs).
Polarization geometry.
In this demo, a real case will first be simulated with computational values, and then used to test the fitting routines.
(TODO: demo from scratch without known matrix elements.)
For fit testing, start with computational values for the matrix elements. These will be used to simulate data, and also to provide a list of parameters to fit later.
[7]:
# Set for ePSproc test data, available from https://github.com/phockett/ePSproc/tree/master/data
# Note this is set here from ep.__path__, but may not be correct in all cases.
# Multiorb data
dataPath = os.path.join(epDemoDataPath, 'photoionization', 'n2_multiorb')
[8]:
data = pemtkFit(fileBase = dataPath, verbose = 1)
[9]:
# Read data files
data.scanFiles()
data.jobsSummary()
*** Job subset details
Key: subset
No 'job' info set for self.data[subset].
*** Job orb6 details
Key: orb6
Dir D:\code\github\ePSproc\data\photoionization\n2_multiorb, 1 file(s).
{ 'batch': 'ePS n2, batch n2_1pu_0.1-50.1eV, orbital A2',
'event': ' N2 A-state (1piu-1)',
'orbE': -17.096913836366,
'orbLabel': '1piu-1'}
*** Job orb5 details
Key: orb5
Dir D:\code\github\ePSproc\data\photoionization\n2_multiorb, 1 file(s).
{ 'batch': 'ePS n2, batch n2_3sg_0.1-50.1eV, orbital A2',
'event': ' N2 X-state (3sg-1)',
'orbE': -17.341816310545997,
'orbLabel': '3sg-1'}
*** Job subset details
Key: subset
No 'job' info set for self.data[subset].
*** Job orb6 details
Key: orb6
Dir D:\code\github\ePSproc\data\photoionization\n2_multiorb, 1 file(s).
{ 'batch': 'ePS n2, batch n2_1pu_0.1-50.1eV, orbital A2',
'event': ' N2 A-state (1piu-1)',
'orbE': -17.096913836366,
'orbLabel': '1piu-1'}
*** Job orb5 details
Key: orb5
Dir D:\code\github\ePSproc\data\photoionization\n2_multiorb, 1 file(s).
{ 'batch': 'ePS n2, batch n2_3sg_0.1-50.1eV, orbital A2',
'event': ' N2 X-state (3sg-1)',
'orbE': -17.341816310545997,
'orbLabel': '3sg-1'}
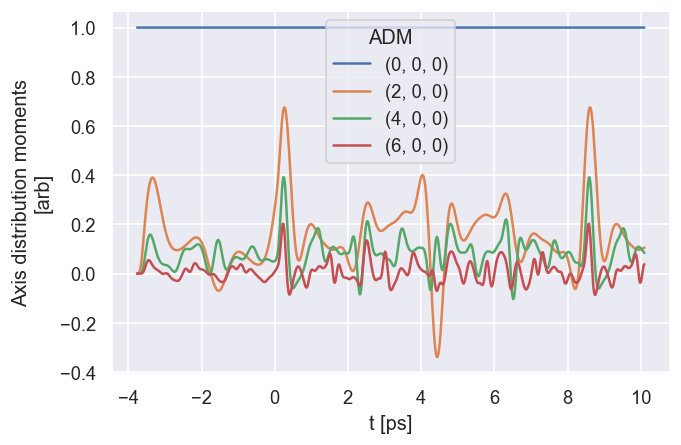
The class wraps ep.setADMs(). This returns an isotropic distribution by default, or values can be set explicitly from a list. Values are set in self.data['ADM'].
Note: if this is not set, the default value will be used, which is likely not very useful for the fit!
[10]:
# Default case
data.setADMs()
# data.ADM['ADMX']
data.data['ADM']['ADM']
[10]:
- ADM: 1
- t: 1
- 1
array([[1]])
- ADM(ADM)MultiIndex(K, Q, S)
array([(0, 0, 0)], dtype=object)
- K(ADM)int640
array([0], dtype=int64)
- Q(ADM)int640
array([0], dtype=int64)
- S(ADM)int640
array([0], dtype=int64)
- t(t)int320
- units :
- Index
array([0])
- dataType :
- ADM
- long_name :
- Axis distribution moments
- units :
- arb
[11]:
# Load time-dependent ADMs for N2 case
# Adapted from ePSproc_AFBLM_testing_010519_300719.m
from scipy.io import loadmat
ADMdataFile = os.path.join(epDemoDataPath, 'alignment', 'N2_ADM_VM_290816.mat')
ADMs = loadmat(ADMdataFile)
# Set tOffset for calcs, 3.76ps!!!
# This is because this is 2-pulse case, and will set t=0 to 2nd pulse (and matches defn. in N2 experimental paper)
tOffset = -3.76
ADMs['time'] = ADMs['time'] + tOffset
data.setADMs(ADMs = ADMs['ADM'], t=ADMs['time'].squeeze(), KQSLabels = ADMs['ADMlist'], addS = True)
data.data['ADM']['ADM']
[11]:
- ADM: 4
- t: 3691
- (1+0j) (1+0j) ... (0.03781316571382804+4.0131898303059876e-16j)
array([[ 1.00000000e+00+0.00000000e+00j, 1.00000000e+00+0.00000000e+00j, 1.00000000e+00+0.00000000e+00j, ..., 1.00000000e+00+0.00000000e+00j, 1.00000000e+00+0.00000000e+00j, 1.00000000e+00+0.00000000e+00j], [-2.26243113e-17+0.00000000e+00j, 2.43430608e-08+1.04125246e-20j, 9.80188266e-08+6.89166168e-20j, ..., 1.05433798e-01-1.62495135e-18j, 1.05433798e-01-1.62495135e-18j, 1.05433798e-01-1.62495135e-18j], [ 1.55724057e-16+0.00000000e+00j, -3.37021111e-10-6.81416260e-20j, 1.95424253e-10-3.10513374e-19j, ..., 8.39913132e-02-5.12795441e-17j, 8.39913132e-02-5.12795441e-17j, 8.39913132e-02-5.12795441e-17j], [-7.68430227e-16+0.00000000e+00j, -1.40177466e-11+1.04987400e-19j, 6.33419102e-10+1.74747003e-18j, ..., 3.78131657e-02+4.01318983e-16j, 3.78131657e-02+4.01318983e-16j, 3.78131657e-02+4.01318983e-16j]]) - ADM(ADM)MultiIndex(K, Q, S)
array([(0, 0, 0), (2, 0, 0), (4, 0, 0), (6, 0, 0)], dtype=object)
- K(ADM)int640 2 4 6
array([0, 2, 4, 6], dtype=int64)
- Q(ADM)int640 0 0 0
array([0, 0, 0, 0], dtype=int64)
- S(ADM)int640 0 0 0
array([0, 0, 0, 0], dtype=int64)
- t(t)float64-3.76 -3.76 -3.76 ... 10.1 10.1
- units :
- ps
array([-3.76 , -3.7598 , -3.7596 , ..., 10.099975, 10.099975, 10.099975])
- dataType :
- ADM
- long_name :
- Axis distribution moments
- units :
- arb
[12]:
# The ADMplot routine will show a basic line plot, note it needs keys = 'ADM' in the current implementation (otherwise will loop over all keys)
data.ADMplot(keys = 'ADM')
Dataset: ADM, ADM
[13]:
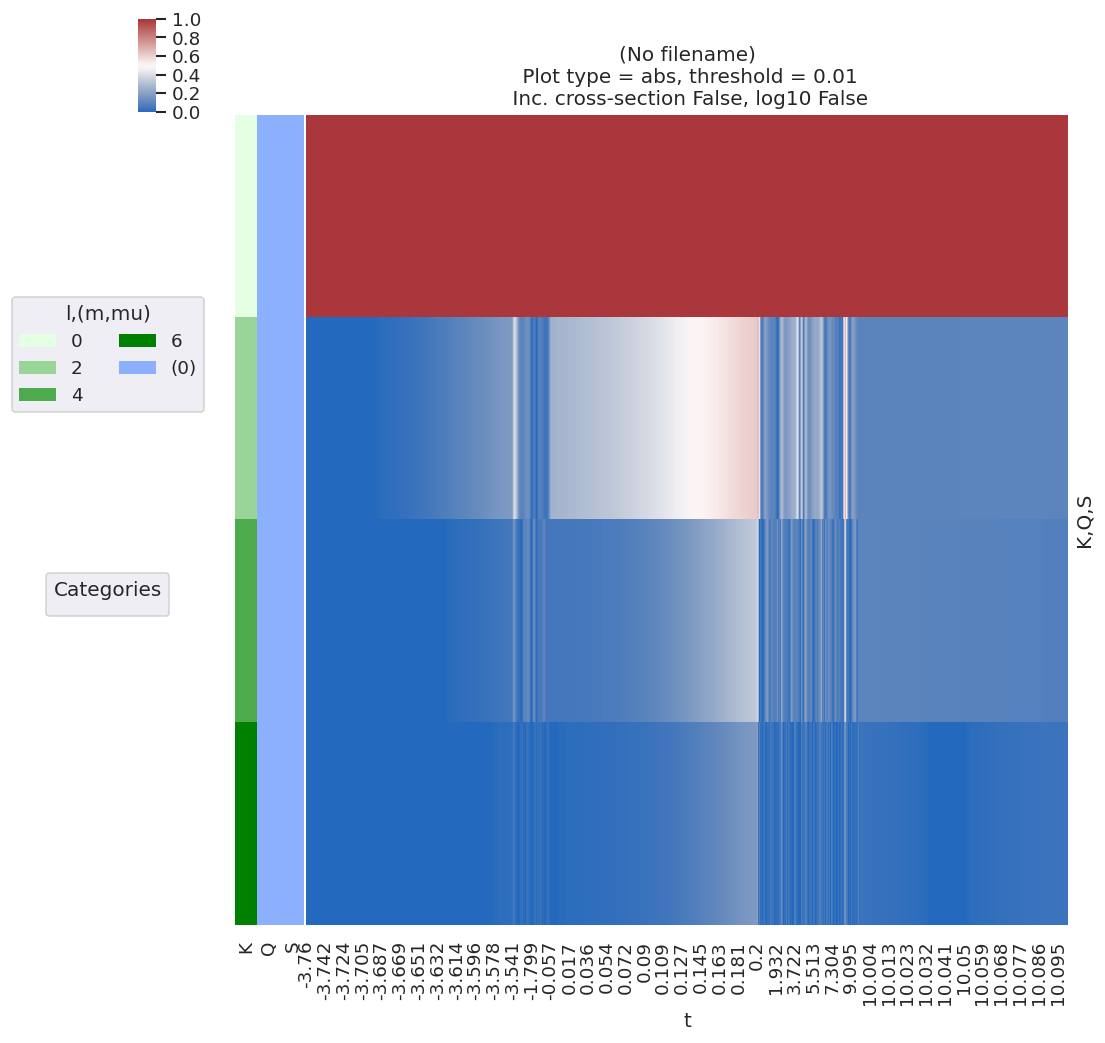
# lmPlot is also handy, it minimally needs the correct keys, dataType and xDim specified
# data.lmPlot(keys = 'ADM', dataType = 'ADM', xDim = 't') # Minimal call
data.lmPlot(keys = 'ADM', dataType = 'ADM', xDim = 't', fillna = True, logFlag = False, cmap = 'vlag') # Set some additional options
Plotting data (No filename), pType=a, thres=0.01, with Seaborn
No handles with labels found to put in legend.
Polarisation geometry/ies
This wraps ep.setPolGeoms. This defaults to (x,y,z) polarization geometries. Values are set in self.data['pol'].
Note: if this is not set, the default value will be used, which is likely not very useful for the fit!
[14]:
data.setPolGeoms()
data.data['pol']['pol']
[14]:
- Labels: 3
- quaternion(1, -0, 0, 0) ... quaternion(0.5, -0.5, 0.5, 0.5)
array([quaternion(1, -0, 0, 0), quaternion(0.707106781186548, -0, 0.707106781186548, 0), quaternion(0.5, -0.5, 0.5, 0.5)], dtype=quaternion) - Euler(Labels)object(0.0, 0.0, 0.0) ... (1.5707963267948966, 1.5707963267948966, 0.0)
array([(0.0, 0.0, 0.0), (0.0, 1.5707963267948966, 0.0), (1.5707963267948966, 1.5707963267948966, 0.0)], dtype=object) - Labels(Labels)<U18'z' 'x' 'y'
array(['z', 'x', 'y'], dtype='<U18')
- dataType :
- Euler
[15]:
# # data.setPolGeoms(eulerAngs = [[0,0,0]], labels = ['z'])
# data.setPolGeoms(eulerAngs = [0,0,0], labels = 'z')
# data.data['pol']['pol'] #.swap_dims({'Euler':'Labels'})
[16]:
# data.data['pol']['pol'] = data.data['pol']['pol'].swap_dims({'Euler':'Labels'})
# data.selOpts['pol'] = {'inds': {'Labels': 'z'}}
# data.setSubset(dataKey = 'pol', dataType = 'pol')
Subselect data
Currently handled in the class by setting self.selOpts, this allows for simple reuse of settings as required. Subselected data is set to self.data['subset'][dataType], and is the data the fitting routine will use.
[17]:
# Settings for type subselection are in selOpts[dataType]
# E.g. Matrix element sub-selection
data.selOpts['matE'] = {'thres': 0.01, 'inds': {'Type':'L', 'Eke':1.1}}
data.setSubset(dataKey = 'orb5', dataType = 'matE') # Subselect from 'orb5' dataset, matrix elements
# Show subselected data
data.data['subset']['matE']
Subselected from dataset 'orb5', dataType 'matE': 36 from 11016 points (0.33%)
[17]:
- LM: 6
- Sym: 2
- mu: 3
- it: 1
- (nan+nanj) (nan+nanj) (nan+nanj) ... (nan+nanj) (nan+nanj)
array([[[[ nan +nanj], [ nan +nanj], [ nan +nanj]], [[ nan +nanj], [ nan +nanj], [ 1.1629411 -1.3536696j ]]], [[[ nan +nanj], [-2.3170597 +1.3587362j ], [ nan +nanj]], [[ nan +nanj], [ nan +nanj], [ nan +nanj]]], [[[ nan +nanj], [ nan +nanj], [ nan +nanj]], [[ 1.1629411 -1.3536696j ], [ nan +nanj], [ nan +nanj]]], [[[ nan +nanj], [ nan +nanj], [ nan +nanj]], [[ nan +nanj], [ nan +nanj], [-0.80272541-0.01697872j]]], [[[ nan +nanj], [ 1.1057219 -0.08717625j], [ nan +nanj]], [[ nan +nanj], [ nan +nanj], [ nan +nanj]]], [[[ nan +nanj], [ nan +nanj], [ nan +nanj]], [[-0.80272541-0.01697872j], [ nan +nanj], [ nan +nanj]]]]) - Ehv()float6418.4
array(18.4)
- mu(mu)int64-1 0 1
array([-1, 0, 1], dtype=int64)
- it(it)int641
array([1], dtype=int64)
- Type()<U1'L'
array('L', dtype='<U1') - Eke()float641.1
array(1.1)
- LM(LM)MultiIndex(l, m)
array([(1, -1), (1, 0), (1, 1), (3, -1), (3, 0), (3, 1)], dtype=object)
- l(LM)int641 1 1 3 3 3
array([1, 1, 1, 3, 3, 3], dtype=int64)
- m(LM)int64-1 0 1 -1 0 1
array([-1, 0, 1, -1, 0, 1], dtype=int64)
- Sym(Sym)MultiIndex(Cont, Targ, Total)
array([('SU', 'SG', 'SU'), ('PU', 'SG', 'PU')], dtype=object) - Cont(Sym)object'SU' 'PU'
array(['SU', 'PU'], dtype=object)
- Targ(Sym)object'SG' 'SG'
array(['SG', 'SG'], dtype=object)
- Total(Sym)object'SU' 'PU'
array(['SU', 'PU'], dtype=object)
- SF()complex128(2.2237521+3.6277801j)
array(2.2237521+3.6277801j)
- E :
- 0.1
- Ehv :
- 15.68
- SF :
- (2.1560627+3.741674j)
- Lmax :
- 11
- Cont :
- SU
- Targ :
- SG
- Total :
- SU
- QNs :
- ['m', 'l', 'mu', 'ip', 'it', 'Value']
- dataType :
- matE
- file :
- n2_3sg_0.1-50.1eV_A2.inp.out
- fileBase :
- D:\code\github\ePSproc\data\photoionization\n2_multiorb
- fileList :
- n2_3sg_0.1-50.1eV_A2.inp.out
- jobLabel :
- 3sg-1
[18]:
# Tabulate the matrix elements
# Not showing as nice table for singleton case - pd.series vs. dataframe?
data.matEtoPD(keys = 'subset', xDim = 'Sym', drop=False)
# data.data['subset']['matE'].attrs['pd'] # PD set here
*** 3sg-1
Matrix element table, threshold=None, data type=complex128.
Cont Targ Total it l m mu
PU SG PU 1 1 -1 1 1.162941-1.353670j
1 -1 1.162941-1.353670j
3 -1 1 -0.802725-0.016979j
1 -1 -0.802725-0.016979j
SU SG SU 1 1 0 0 -2.317060+1.358736j
3 0 0 1.105722-0.087176j
dtype: complex128
[19]:
# And for the polarisation geometries...
data.selOpts['pol'] = {'inds': {'Labels': 'z'}}
data.setSubset(dataKey = 'pol', dataType = 'pol')
Subselected from dataset 'pol', dataType 'pol': 1 from 3 points (33.33%)
[20]:
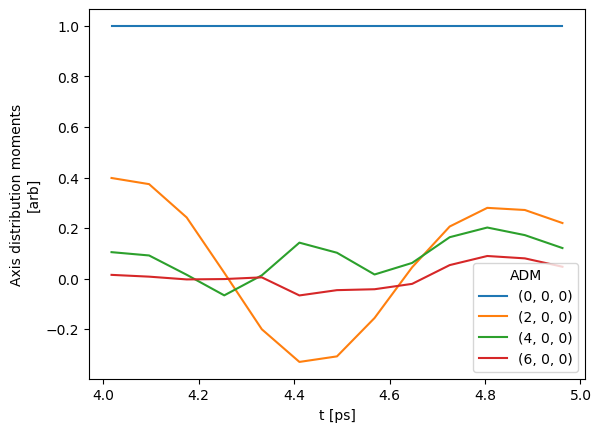
# And for the ADMs...
data.selOpts['ADM'] = {} #{'thres': 0.01, 'inds': {'Type':'L', 'Eke':1.1}}
data.setSubset(dataKey = 'ADM', dataType = 'ADM', sliceParams = {'t':[4, 5, 4]})
data.ADMplot(keys = 'subset')
Subselected from dataset 'ADM', dataType 'ADM': 52 from 14764 points (0.35%)
Dataset: subset, ADM
[21]:
# Cusomise plot with return...
# NOT YET IMPLEMENTED
# pltObj = data.ADMplot(keys = 'subset')
# pltObj
[22]:
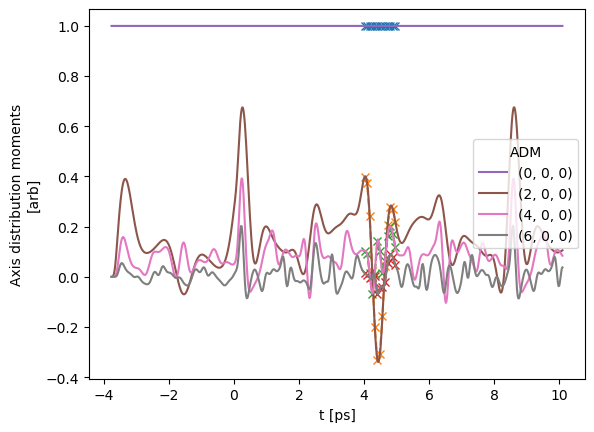
# Plot from Xarray vs. full dataset
# data.data['subset']['ADM'].where(ADMX['K']>0).real.squeeze().plot.line(x='t');
data.data['subset']['ADM'].real.squeeze().plot.line(x='t', marker = 'x', linestyle='dashed');
data.data['ADM']['ADM'].real.squeeze().plot.line(x='t');
Compute AF-\(\beta_{LM}\) and simulate data
With all the components set, some observables can be calculated. For testing, we’ll also use this to simulate an experiemental trace…
Here we’ll use self.afblmMatEfit(), which is also the main fitting routine, and essentially wraps epsproc.afblmXprod() to compute AF-\(\beta_{LM}\)s (for more details, see the ePSproc method development docs).
If called without reference data, the method returns computed AF-\(\beta_{LM}\)s based on the input subsets already created, and also a set of (product) basis functions generated - these can be examined to get a feel for the sensitivity of the geometric part of the problem, and will also be used in fitting to limit repetitive computation.
Compute AF-\(\beta_{LM}\)s
[23]:
# data.afblmMatEfit(data = None) # OK
BetaNormX, basis = data.afblmMatEfit() # OK, uses default polarizations & ADMs as set in data['subset']
# BetaNormX, basis = data.afblmMatEfit(ADM = data.data['subset']['ADM']) # OK, but currently using default polarizations
# BetaNormX, basis = data.afblmMatEfit(ADM = data.data['subset']['ADM'], pol = data.data['pol']['pol'].sel(Labels=['x']))
# BetaNormX, basis = data.afblmMatEfit(ADM = data.data['subset']['ADM'], pol = data.data['pol']['pol'].sel(Labels=['x','y'])) # This fails for a single label...?
# BetaNormX, basis = data.afblmMatEfit(RX=data.data['pol']['pol']) # This currently fails, need to check for consistency in ep.sphCalc.WDcalc()
# - looks like set values and inputs are not consistent in this case? Not passing angs correctly, or overriding?
# - See also recently-added sfError flag, which may cause additional problems.
AF-\(\beta_{LM}\)s
The returned objects contain the \(\beta_{LM}\) parameters as an Xarray…
[24]:
BetaNormX
[24]:
- Labels: 1
- t: 13
- BLM: 15
- 0j (1.668823121150882+5.788281730622143e-18j) ... 0j
array([[[ 0.00000000e+00+0.00000000e+00j, 1.66882312e+00+5.78828173e-18j, 0.00000000e+00+0.00000000e+00j, 0.00000000e+00+0.00000000e+00j, 9.25154735e-01-2.04255472e-18j, 0.00000000e+00+0.00000000e+00j, 0.00000000e+00+0.00000000e+00j, 0.00000000e+00+0.00000000e+00j, 0.00000000e+00+0.00000000e+00j, 0.00000000e+00+0.00000000e+00j, -1.45626494e-01-2.50162312e-18j, 0.00000000e+00+0.00000000e+00j, 0.00000000e+00+0.00000000e+00j, 9.05679279e-03+2.69005757e-19j, 0.00000000e+00+0.00000000e+00j], [ 0.00000000e+00+0.00000000e+00j, 1.65939046e+00-7.23129056e-18j, 0.00000000e+00+0.00000000e+00j, 0.00000000e+00+0.00000000e+00j, 9.28209270e-01-1.20305969e-17j, 0.00000000e+00+0.00000000e+00j, 0.00000000e+00+0.00000000e+00j, 0.00000000e+00+0.00000000e+00j, 0.00000000e+00+0.00000000e+00j, 0.00000000e+00+0.00000000e+00j, -1.35884180e-01+7.60995910e-18j, 0.00000000e+00+0.00000000e+00j, 0.00000000e+00+0.00000000e+00j, 7.87360160e-03-5.26232236e-19j, 0.00000000e+00+0.00000000e+00j], [ 0.00000000e+00+0.00000000e+00j, 1.60819595e+00+5.37946903e-19j, 0.00000000e+00+0.00000000e+00j, 0.00000000e+00+0.00000000e+00j, 9.44773203e-01+2.80576809e-17j, 0.00000000e+00+0.00000000e+00j, 0.00000000e+00+0.00000000e+00j, 0.00000000e+00+0.00000000e+00j, 0.00000000e+00+0.00000000e+00j, 0.00000000e+00+0.00000000e+00j, -8.24684513e-02-1.29331051e-18j, 0.00000000e+00+0.00000000e+00j, 0.00000000e+00+0.00000000e+00j, 1.24796733e-03+1.99111244e-19j, 0.00000000e+00+0.00000000e+00j], [ 0.00000000e+00+0.00000000e+00j, 1.52326324e+00-1.50526506e-18j, 0.00000000e+00+0.00000000e+00j, 0.00000000e+00+0.00000000e+00j, 9.72371636e-01+7.27400639e-19j, 0.00000000e+00+0.00000000e+00j, 0.00000000e+00+0.00000000e+00j, 0.00000000e+00+0.00000000e+00j, 0.00000000e+00+0.00000000e+00j, 0.00000000e+00+0.00000000e+00j, 4.93224211e-04+1.20678198e-18j, 0.00000000e+00+0.00000000e+00j, 0.00000000e+00+0.00000000e+00j, -5.69662854e-03-1.12782141e-19j, 0.00000000e+00+0.00000000e+00j], [ 0.00000000e+00+0.00000000e+00j, 1.43634451e+00+9.52773406e-18j, 0.00000000e+00+0.00000000e+00j, 0.00000000e+00+0.00000000e+00j, 1.00104159e+00+2.33569626e-17j, 0.00000000e+00+0.00000000e+00j, 0.00000000e+00+0.00000000e+00j, 0.00000000e+00+0.00000000e+00j, 0.00000000e+00+0.00000000e+00j, 0.00000000e+00+0.00000000e+00j, 6.53535497e-02-2.06092931e-18j, 0.00000000e+00+0.00000000e+00j, 0.00000000e+00+0.00000000e+00j, 1.13815711e-03-3.50093184e-18j, 0.00000000e+00+0.00000000e+00j], [ 0.00000000e+00+0.00000000e+00j, 1.38620024e+00+9.20243198e-19j, 0.00000000e+00+0.00000000e+00j, 0.00000000e+00+0.00000000e+00j, 1.01780024e+00-1.33980425e-18j, 0.00000000e+00+0.00000000e+00j, 0.00000000e+00+0.00000000e+00j, 0.00000000e+00+0.00000000e+00j, 0.00000000e+00+0.00000000e+00j, 0.00000000e+00+0.00000000e+00j, 9.28414140e-02+2.05936950e-18j, 0.00000000e+00+0.00000000e+00j, 0.00000000e+00+0.00000000e+00j, 1.15029998e-02-1.86868078e-18j, 0.00000000e+00+0.00000000e+00j], [ 0.00000000e+00+0.00000000e+00j, 1.39472246e+00-4.45373740e-18j, 0.00000000e+00+0.00000000e+00j, 0.00000000e+00+0.00000000e+00j, 1.01490490e+00+1.74312370e-18j, 0.00000000e+00+0.00000000e+00j, 0.00000000e+00+0.00000000e+00j, 0.00000000e+00+0.00000000e+00j, 0.00000000e+00+0.00000000e+00j, 0.00000000e+00+0.00000000e+00j, 9.03441438e-02+2.26699795e-18j, 0.00000000e+00+0.00000000e+00j, 0.00000000e+00+0.00000000e+00j, 8.28715378e-03+9.94032689e-19j, 0.00000000e+00+0.00000000e+00j], [ 0.00000000e+00+0.00000000e+00j, 1.45369338e+00+7.91745171e-19j, 0.00000000e+00+0.00000000e+00j, 0.00000000e+00+0.00000000e+00j, 9.95369088e-01+2.73033702e-17j, 0.00000000e+00+0.00000000e+00j, 0.00000000e+00+0.00000000e+00j, 0.00000000e+00+0.00000000e+00j, 0.00000000e+00+0.00000000e+00j, 0.00000000e+00+0.00000000e+00j, 5.02659008e-02+1.13177636e-18j, 0.00000000e+00+0.00000000e+00j, 0.00000000e+00+0.00000000e+00j, 9.75429570e-04-6.51669777e-19j, 0.00000000e+00+0.00000000e+00j], [ 0.00000000e+00+0.00000000e+00j, 1.53164115e+00+1.13429074e-17j, 0.00000000e+00+0.00000000e+00j, 0.00000000e+00+0.00000000e+00j, 9.69964449e-01-3.96161113e-18j, 0.00000000e+00+0.00000000e+00j, 0.00000000e+00+0.00000000e+00j, 0.00000000e+00+0.00000000e+00j, 0.00000000e+00+0.00000000e+00j, 0.00000000e+00+0.00000000e+00j, -2.24085809e-02-7.42900134e-18j, 0.00000000e+00+0.00000000e+00j, 0.00000000e+00+0.00000000e+00j, 5.08531171e-03-3.02631277e-18j, 0.00000000e+00+0.00000000e+00j], [ 0.00000000e+00+0.00000000e+00j, 1.59428225e+00-1.99642906e-18j, 0.00000000e+00+0.00000000e+00j, 0.00000000e+00+0.00000000e+00j, 9.49718737e-01+1.56864870e-17j, 0.00000000e+00+0.00000000e+00j, 0.00000000e+00+0.00000000e+00j, 0.00000000e+00+0.00000000e+00j, 0.00000000e+00+0.00000000e+00j, 0.00000000e+00+0.00000000e+00j, -8.90643638e-02-5.46842630e-18j, 0.00000000e+00+0.00000000e+00j, 0.00000000e+00+0.00000000e+00j, 1.44722472e-02+1.25126193e-18j, 0.00000000e+00+0.00000000e+00j], [ 0.00000000e+00+0.00000000e+00j, 1.62292950e+00-6.46048690e-18j, 0.00000000e+00+0.00000000e+00j, 0.00000000e+00+0.00000000e+00j, 9.40438270e-01+1.76164331e-17j, 0.00000000e+00+0.00000000e+00j, 0.00000000e+00+0.00000000e+00j, 0.00000000e+00+0.00000000e+00j, 0.00000000e+00+0.00000000e+00j, 0.00000000e+00+0.00000000e+00j, -1.18540934e-01-1.18827450e-18j, 0.00000000e+00+0.00000000e+00j, 0.00000000e+00+0.00000000e+00j, 1.80790278e-02+3.96263817e-18j, 0.00000000e+00+0.00000000e+00j], [ 0.00000000e+00+0.00000000e+00j, 1.61964948e+00-9.65063099e-18j, 0.00000000e+00+0.00000000e+00j, 0.00000000e+00+0.00000000e+00j, 9.41433561e-01-1.12629747e-17j, 0.00000000e+00+0.00000000e+00j, 0.00000000e+00+0.00000000e+00j, 0.00000000e+00+0.00000000e+00j, 0.00000000e+00+0.00000000e+00j, 0.00000000e+00+0.00000000e+00j, -1.11981456e-01+8.46145725e-18j, 0.00000000e+00+0.00000000e+00j, 0.00000000e+00+0.00000000e+00j, 1.54232880e-02+1.10625182e-18j, 0.00000000e+00+0.00000000e+00j], [ 0.00000000e+00+0.00000000e+00j, 1.59961793e+00+3.78243863e-18j, 0.00000000e+00+0.00000000e+00j, 0.00000000e+00+0.00000000e+00j, 9.47859045e-01-1.46603781e-18j, 0.00000000e+00+0.00000000e+00j, 0.00000000e+00+0.00000000e+00j, 0.00000000e+00+0.00000000e+00j, 0.00000000e+00+0.00000000e+00j, 0.00000000e+00+0.00000000e+00j, -8.83338758e-02-1.35167290e-18j, 0.00000000e+00+0.00000000e+00j, 0.00000000e+00+0.00000000e+00j, 1.07442112e-02+1.22430637e-18j, 0.00000000e+00+0.00000000e+00j]]]) - Euler(Labels)object(0.0, 0.0, 0.0)
array([(0.0, 0.0, 0.0)], dtype=object)
- Labels(Labels)<U1'A'
array(['A'], dtype='<U1')
- t(t)float644.018 4.096 4.175 ... 4.884 4.962
- units :
- ps
array([4.017657, 4.096371, 4.175086, 4.253801, 4.332516, 4.41123 , 4.489945, 4.56866 , 4.647375, 4.726089, 4.804804, 4.883519, 4.962233]) - Ehv()float6418.4
array(18.4)
- Type()<U1'L'
array('L', dtype='<U1') - Eke()float641.1
array(1.1)
- SF()complex128(2.2237521+3.6277801j)
array(2.2237521+3.6277801j)
- XSraw(Labels, t)complex128(1.668823121150882+5.788281730622143e-18j) ... (1.5996179261474746+3.782438628664796e-18j)
array([[1.66882312+5.78828173e-18j, 1.65939046-7.23129056e-18j, 1.60819595+5.37946903e-19j, 1.52326324-1.50526506e-18j, 1.43634451+9.52773406e-18j, 1.38620024+9.20243198e-19j, 1.39472246-4.45373740e-18j, 1.45369338+7.91745171e-19j, 1.53164115+1.13429074e-17j, 1.59428225-1.99642906e-18j, 1.6229295 -6.46048690e-18j, 1.61964948-9.65063099e-18j, 1.59961793+3.78243863e-18j]]) - XSrescaled(Labels, t)complex128(5.915823935128086+2.0518924487134524e-17j) ... (5.670497906355172+1.3408395826381391e-17j)
array([[5.91582394+2.05189245e-17j, 5.88238602-2.56342576e-17j, 5.70090622+1.90697212e-18j, 5.39982759-5.33602569e-18j, 5.09170872+3.37749379e-17j, 4.91395189+3.26217720e-18j, 4.9441624 -1.57880880e-17j, 5.15320886+2.80666355e-18j, 5.4295265 +4.02095600e-17j, 5.65158343-7.07715676e-18j, 5.75313528-2.29018298e-17j, 5.74150791-3.42105961e-17j, 5.67049791+1.34083958e-17j]]) - XSiso()complex128(5.36805661023236+0j)
array(5.36805661+0.j)
- BLM(BLM)MultiIndex(l, m)
array([(0, -1), (0, 0), (0, 1), (2, -1), (2, 0), (2, 1), (3, -1), (3, 0), (3, 1), (4, -1), (4, 0), (4, 1), (6, -1), (6, 0), (6, 1)], dtype=object) - l(BLM)int640 0 0 2 2 2 3 3 3 4 4 4 6 6 6
array([0, 0, 0, 2, 2, 2, 3, 3, 3, 4, 4, 4, 6, 6, 6], dtype=int64)
- m(BLM)int64-1 0 1 -1 0 1 -1 0 1 -1 0 1 -1 0 1
array([-1, 0, 1, -1, 0, 1, -1, 0, 1, -1, 0, 1, -1, 0, 1], dtype=int64)
- E :
- 0.1
- Ehv :
- 15.68
- SF :
- (2.1560627+3.741674j)
- Lmax :
- 11
- Cont :
- SU
- Targ :
- SG
- Total :
- SU
- QNs :
- None
- dataType :
- BLM
- file :
- n2_3sg_0.1-50.1eV_A2.inp.out
- fileBase :
- D:\code\github\ePSproc\data\photoionization\n2_multiorb
- fileList :
- n2_3sg_0.1-50.1eV_A2.inp.out
- jobLabel :
- 3sg-1
- pd :
- Cont Targ Total it l m mu PU SG PU 1 1 -1 1 1.162941-1.353670j 1 -1 1.162941-1.353670j 3 -1 1 -0.802725-0.016979j 1 -1 -0.802725-0.016979j SU SG SU 1 1 0 0 -2.317060+1.358736j 3 0 0 1.105722-0.087176j dtype: complex128
- EPRX :
- None
- p :
- [0]
- BLMtable :
- None
- BLMtableResort :
- None
- lambdaTerm :
- None
- polProd :
- None
- AFterm :
- None
- thres :
- None
- thresDims :
- Eke
- selDims :
- {}
- sumDims :
- ['mu', 'mup', 'l', 'lp', 'm', 'mp', 'S-Rp']
- sumDimsPol :
- ['P', 'R', 'Rp', 'p']
- symSum :
- True
- degenDrop :
- True
- SFflag :
- False
- SFflagRenorm :
- False
- BLMRenorm :
- 0
- squeeze :
- False
- phaseConvention :
- E
- basisReturn :
- ProductBasis
- verbose :
- 0
- kwargs :
- {'RX': <xarray.DataArray ()> array(quaternion(1, -0, 0, 0), dtype=quaternion) Coordinates: Euler object (0.0, 0.0, 0.0) Labels <U18 'z' Attributes: dataType: Euler}
- matEleSelector :
- <function matEleSelector at 0x000002750963FBF8>
- degenDict :
- {'it': <xarray.DataArray 'it' (it: 1)> array([1], dtype=int64) Coordinates: Ehv float64 18.4 * it (it) int64 1 Type <U1 'L' Eke float64 1.1 SF complex128 (2.2237521+3.6277801j), 'degenN': array(1, dtype=int64), 'degenFlag': False, 'degenDrop': True, 'selDims': {}}
[25]:
# ep.BLMplot(BetaNormX, xDim = 't') # SIGH, not working - issue with Euler/Labels?
# BetaNormX.sel(Labels='z').real.squeeze().plot.line(x='t');
# ep.lmPlot(BetaNormX.sel(Labels='z'), xDim='t', SFflag=False); #, cmap='vlag');
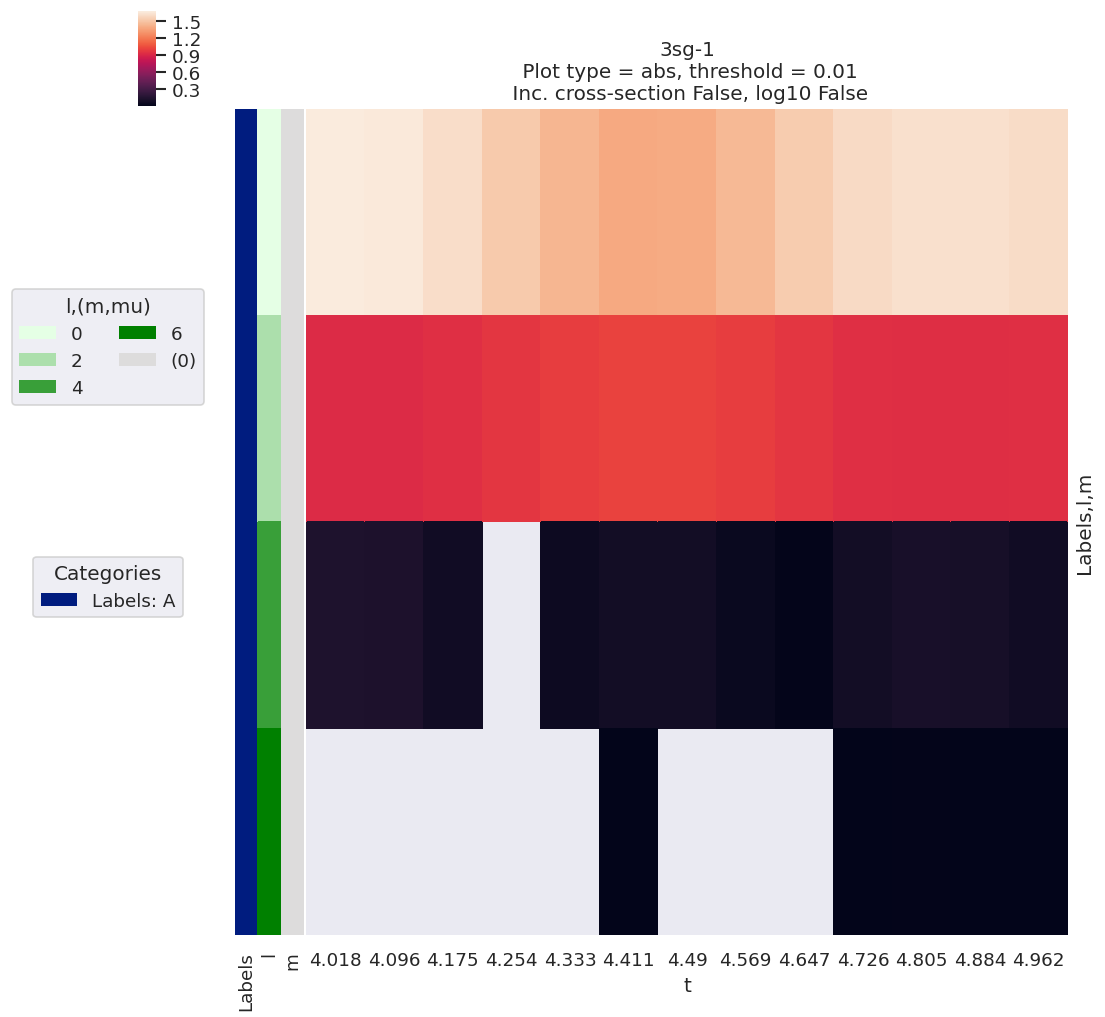
ep.lmPlot(BetaNormX, xDim='t', SFflag=False);
# data.lmPlot()
Plotting data n2_3sg_0.1-50.1eV_A2.inp.out, pType=a, thres=0.01, with Seaborn
[26]:
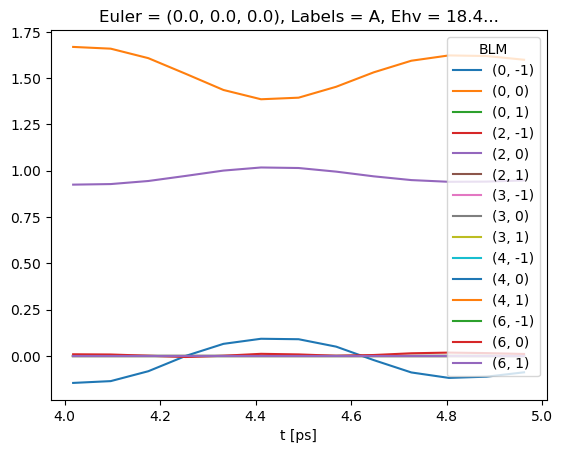
# Line-plot with Xarray/Matplotlib
# Note there is no filtering here, so this includes some invalid and null terms
BetaNormX.sel(Labels='A').real.squeeze().plot.line(x='t');
… and the basis sets as a dictionary.
[27]:
basis.keys()
[27]:
dict_keys(['BLMtableResort', 'polProd', 'phaseConvention', 'BLMRenorm'])
Note that the basis sets here will may be useful for deeper insight into the physics, and fitting routines, and are explored in a separate notebook.
Fitting the data
In order to fit data, and extract matrix elements from an experimental case, we’ll use the lmfit library. This wraps core Scipy fitting routines with additional objects and methods, and is further wrapped for this specific class of problems in pemtkFit class we’re using here.
Set the data to fit
Here we’ll use the values calculated above as our test data. This currently needs to be set as self.data['subset']['AFBLM'] for fitting.
[28]:
# data.data['subset']['AFBLM'] = BetaNormX # Set manually
data.setData('sim', BetaNormX) # Set simulated data to master structure as "sim"
data.setSubset('sim','AFBLM') # Set to 'subset' to use for fitting.
Subselected from dataset 'sim', dataType 'AFBLM': 195 from 195 points (100.00%)
[29]:
# Set basis functions
data.basis = basis
Setting up the fit parameters
In this case, we can work from the existing matrix elements to speed up parameter creation, although in practice this may need to be approached ab initio - nonetheless, the method will be the same, and the ab initio case detailed later.
[30]:
# Input set, as defined earlier
data.data['subset']['matE'].pd
[30]:
Cont Targ Total it l m mu
PU SG PU 1 1 -1 1 1.162941-1.353670j
1 -1 1.162941-1.353670j
3 -1 1 -0.802725-0.016979j
1 -1 -0.802725-0.016979j
SU SG SU 1 1 0 0 -2.317060+1.358736j
3 0 0 1.105722-0.087176j
dtype: complex128
[31]:
# data.setMatEFit() # Need to fix self.subset usage
data.setMatEFit(data.data['subset']['matE']) #, Eke=1.1) # Some hard-coded things to fix here! Now roughly working.
Set 6 complex matrix elements to 12 fitting params, see self.params for details.
C:\Users\femtolab\.conda\envs\ePSdev\lib\site-packages\pandas\core\generic.py:3939: SettingWithCopyWarning:
A value is trying to be set on a copy of a slice from a DataFrame
See the caveats in the documentation: https://pandas.pydata.org/pandas-docs/stable/user_guide/indexing.html#returning-a-view-versus-a-copy
self._update_inplace(obj)
Auto-setting parameters.
| name | value | initial value | min | max | vary | expression |
|---|---|---|---|---|---|---|
| m_PU_SG_PU_1_n1_1_1 | 1.78461575 | 1.784615753610107 | 1.0000e-04 | 5.00000000 | True | |
| m_PU_SG_PU_1_1_n1_1 | 1.78461575 | 1.784615753610107 | 1.0000e-04 | 5.00000000 | False | m_PU_SG_PU_1_n1_1_1 |
| m_PU_SG_PU_3_n1_1_1 | 0.80290495 | 0.802904951323892 | 1.0000e-04 | 5.00000000 | True | |
| m_PU_SG_PU_3_1_n1_1 | 0.80290495 | 0.802904951323892 | 1.0000e-04 | 5.00000000 | False | m_PU_SG_PU_3_n1_1_1 |
| m_SU_SG_SU_1_0_0_1 | 2.68606212 | 2.686062120382649 | 1.0000e-04 | 5.00000000 | True | |
| m_SU_SG_SU_3_0_0_1 | 1.10915311 | 1.109153108617096 | 1.0000e-04 | 5.00000000 | True | |
| p_PU_SG_PU_1_n1_1_1 | -0.86104140 | -0.8610414024232179 | -3.14159265 | 3.14159265 | False | |
| p_PU_SG_PU_1_1_n1_1 | -0.86104140 | -0.8610414024232179 | -3.14159265 | 3.14159265 | False | p_PU_SG_PU_1_n1_1_1 |
| p_PU_SG_PU_3_n1_1_1 | -3.12044446 | -3.1204444620772467 | -3.14159265 | 3.14159265 | True | |
| p_PU_SG_PU_3_1_n1_1 | -3.12044446 | -3.1204444620772467 | -3.14159265 | 3.14159265 | False | p_PU_SG_PU_3_n1_1_1 |
| p_SU_SG_SU_1_0_0_1 | 2.61122920 | 2.611229196458127 | -3.14159265 | 3.14159265 | True | |
| p_SU_SG_SU_3_0_0_1 | -0.07867828 | -0.07867827542158025 | -3.14159265 | 3.14159265 | True |
This sets self.params from the matrix elements, which are a set of (real) parameters for lmfit, as a Parameters object.
Note that:
The input matrix elements are converted to magnitude-phase form, hence there are twice the number as the input array, and labelled
morpaccordingly, along with a name based on the full set of QNs/indexes set.One phase is set to
vary=False, which defines a reference phase. This defaults to the first phase item.Min and max values are defined, by default the ranges are 1e-4<mag<5, -pi<phase<pi.
Relationships between the parameters are set by default, but can be set manually, see section below, or pass
paramsCons=Noneto skip.
[32]:
data.params
[32]:
| name | value | initial value | min | max | vary | expression |
|---|---|---|---|---|---|---|
| m_PU_SG_PU_1_n1_1_1 | 1.78461575 | 1.784615753610107 | 1.0000e-04 | 5.00000000 | True | |
| m_PU_SG_PU_1_1_n1_1 | 1.78461575 | 1.784615753610107 | 1.0000e-04 | 5.00000000 | False | m_PU_SG_PU_1_n1_1_1 |
| m_PU_SG_PU_3_n1_1_1 | 0.80290495 | 0.802904951323892 | 1.0000e-04 | 5.00000000 | True | |
| m_PU_SG_PU_3_1_n1_1 | 0.80290495 | 0.802904951323892 | 1.0000e-04 | 5.00000000 | False | m_PU_SG_PU_3_n1_1_1 |
| m_SU_SG_SU_1_0_0_1 | 2.68606212 | 2.686062120382649 | 1.0000e-04 | 5.00000000 | True | |
| m_SU_SG_SU_3_0_0_1 | 1.10915311 | 1.109153108617096 | 1.0000e-04 | 5.00000000 | True | |
| p_PU_SG_PU_1_n1_1_1 | -0.86104140 | -0.8610414024232179 | -3.14159265 | 3.14159265 | False | |
| p_PU_SG_PU_1_1_n1_1 | -0.86104140 | -0.8610414024232179 | -3.14159265 | 3.14159265 | False | p_PU_SG_PU_1_n1_1_1 |
| p_PU_SG_PU_3_n1_1_1 | -3.12044446 | -3.1204444620772467 | -3.14159265 | 3.14159265 | True | |
| p_PU_SG_PU_3_1_n1_1 | -3.12044446 | -3.1204444620772467 | -3.14159265 | 3.14159265 | False | p_PU_SG_PU_3_n1_1_1 |
| p_SU_SG_SU_1_0_0_1 | 2.61122920 | 2.611229196458127 | -3.14159265 | 3.14159265 | True | |
| p_SU_SG_SU_3_0_0_1 | -0.07867828 | -0.07867827542158025 | -3.14159265 | 3.14159265 | True |
Running a fit…
With the parameters and data set, just call self.fit()!
Statistics and outputs are handled by lmfit, which includes uncertainty estimates and correlations in the fitted parameters.
[33]:
data.fit()
[34]:
# Check fit outputs - self.result shows results from the last fit
data.result
[34]:
Fit Statistics
| fitting method | leastsq | |
| # function evals | 9 | |
| # data points | 195 | |
| # variables | 7 | |
| chi-square | 6.8943e-31 | |
| reduced chi-square | 3.6672e-33 | |
| Akaike info crit. | -14556.8750 | |
| Bayesian info crit. | -14533.9640 |
Variables
| name | value | standard error | relative error | initial value | min | max | vary | expression |
|---|---|---|---|---|---|---|---|---|
| m_PU_SG_PU_1_n1_1_1 | 1.78461575 | 1.0341e-16 | (0.00%) | 1.784615753610107 | 1.0000e-04 | 5.00000000 | True | |
| m_PU_SG_PU_1_1_n1_1 | 1.78461575 | 1.0341e-16 | (0.00%) | 1.784615753610107 | 1.0000e-04 | 5.00000000 | False | m_PU_SG_PU_1_n1_1_1 |
| m_PU_SG_PU_3_n1_1_1 | 0.80290495 | 2.9681e-16 | (0.00%) | 0.802904951323892 | 1.0000e-04 | 5.00000000 | True | |
| m_PU_SG_PU_3_1_n1_1 | 0.80290495 | 2.9681e-16 | (0.00%) | 0.802904951323892 | 1.0000e-04 | 5.00000000 | False | m_PU_SG_PU_3_n1_1_1 |
| m_SU_SG_SU_1_0_0_1 | 2.68606212 | 6.1249e-16 | (0.00%) | 2.686062120382649 | 1.0000e-04 | 5.00000000 | True | |
| m_SU_SG_SU_3_0_0_1 | 1.10915311 | 1.4848e-15 | (0.00%) | 1.109153108617096 | 1.0000e-04 | 5.00000000 | True | |
| p_PU_SG_PU_1_n1_1_1 | -0.86104140 | 0.00000000 | (0.00%) | -0.8610414024232179 | -3.14159265 | 3.14159265 | False | |
| p_PU_SG_PU_1_1_n1_1 | -0.86104140 | 0.00000000 | (0.00%) | -0.8610414024232179 | -3.14159265 | 3.14159265 | False | p_PU_SG_PU_1_n1_1_1 |
| p_PU_SG_PU_3_n1_1_1 | -3.12044446 | 5.6474e-16 | (0.00%) | -3.1204444620772467 | -3.14159265 | 3.14159265 | True | |
| p_PU_SG_PU_3_1_n1_1 | -3.12044446 | 5.6474e-16 | (0.00%) | -3.1204444620772467 | -3.14159265 | 3.14159265 | False | p_PU_SG_PU_3_n1_1_1 |
| p_SU_SG_SU_1_0_0_1 | 2.61122920 | 3.9590e-16 | (0.00%) | 2.611229196458127 | -3.14159265 | 3.14159265 | True | |
| p_SU_SG_SU_3_0_0_1 | -0.07867828 | 1.6651e-15 | (0.00%) | -0.07867827542158025 | -3.14159265 | 3.14159265 | True |
Correlations (unreported correlations are < 0.100)
| m_SU_SG_SU_1_0_0_1 | m_SU_SG_SU_3_0_0_1 | -0.9874 |
| p_SU_SG_SU_1_0_0_1 | p_SU_SG_SU_3_0_0_1 | -0.9098 |
| m_SU_SG_SU_3_0_0_1 | p_SU_SG_SU_3_0_0_1 | -0.8968 |
| m_SU_SG_SU_1_0_0_1 | p_SU_SG_SU_3_0_0_1 | 0.8855 |
| m_SU_SG_SU_1_0_0_1 | p_SU_SG_SU_1_0_0_1 | -0.8394 |
| m_SU_SG_SU_3_0_0_1 | p_SU_SG_SU_1_0_0_1 | 0.8261 |
| m_PU_SG_PU_1_n1_1_1 | m_PU_SG_PU_3_n1_1_1 | -0.7856 |
| m_PU_SG_PU_1_n1_1_1 | p_SU_SG_SU_1_0_0_1 | -0.5380 |
| m_PU_SG_PU_3_n1_1_1 | p_SU_SG_SU_1_0_0_1 | 0.4552 |
| p_PU_SG_PU_3_n1_1_1 | p_SU_SG_SU_3_0_0_1 | -0.3845 |
| m_PU_SG_PU_1_n1_1_1 | p_SU_SG_SU_3_0_0_1 | 0.2973 |
| m_PU_SG_PU_3_n1_1_1 | p_SU_SG_SU_3_0_0_1 | -0.1802 |
| m_SU_SG_SU_3_0_0_1 | p_PU_SG_PU_3_n1_1_1 | 0.1514 |
| m_PU_SG_PU_1_n1_1_1 | p_PU_SG_PU_3_n1_1_1 | -0.1424 |
| p_PU_SG_PU_3_n1_1_1 | p_SU_SG_SU_1_0_0_1 | 0.1299 |
| m_PU_SG_PU_3_n1_1_1 | p_PU_SG_PU_3_n1_1_1 | -0.1198 |
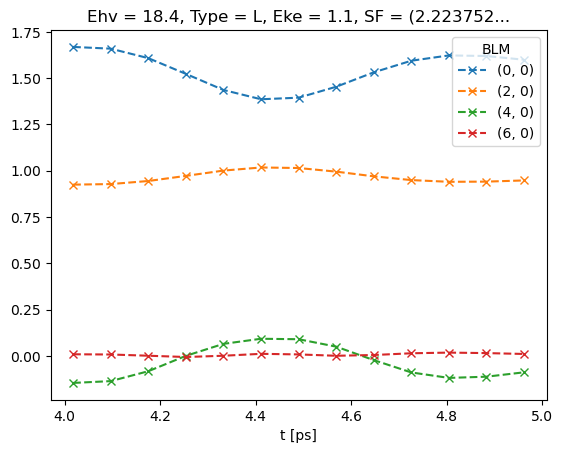
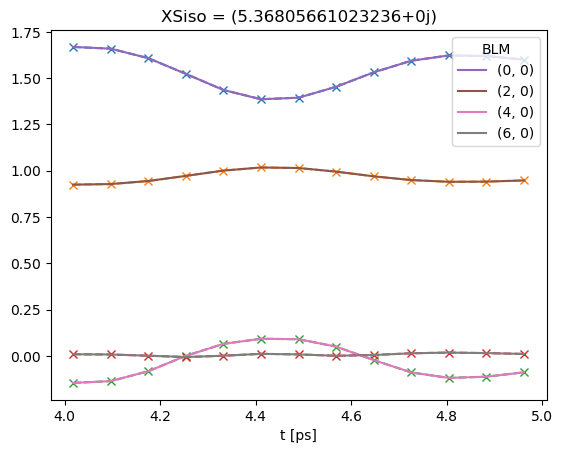
Results vs. data can be (crudely) plotted with self.BLMfitPlot() (better plotting routines to follow!).
This will plot all results by default, vs. the subset data used for the fitting routine inputs.
[35]:
# Plot data subset (--x) plus fit (solid lines)
data.BLMfitPlot()
Dataset: subset, AFBLM
[36]:
# Fit results are currently added to the main data dict by an index number
data.data.keys()
[36]:
dict_keys(['subset', 'orb6', 'orb5', 'ADM', 'pol', 'sim', 0])
[37]:
# The current fit index is set in self.fitInd
data.fitInd
[37]:
0
[38]:
# Full results are available from the main data structure
data.data[data.fitInd].keys()
[38]:
dict_keys(['AFBLM', 'residual', 'results'])
[39]:
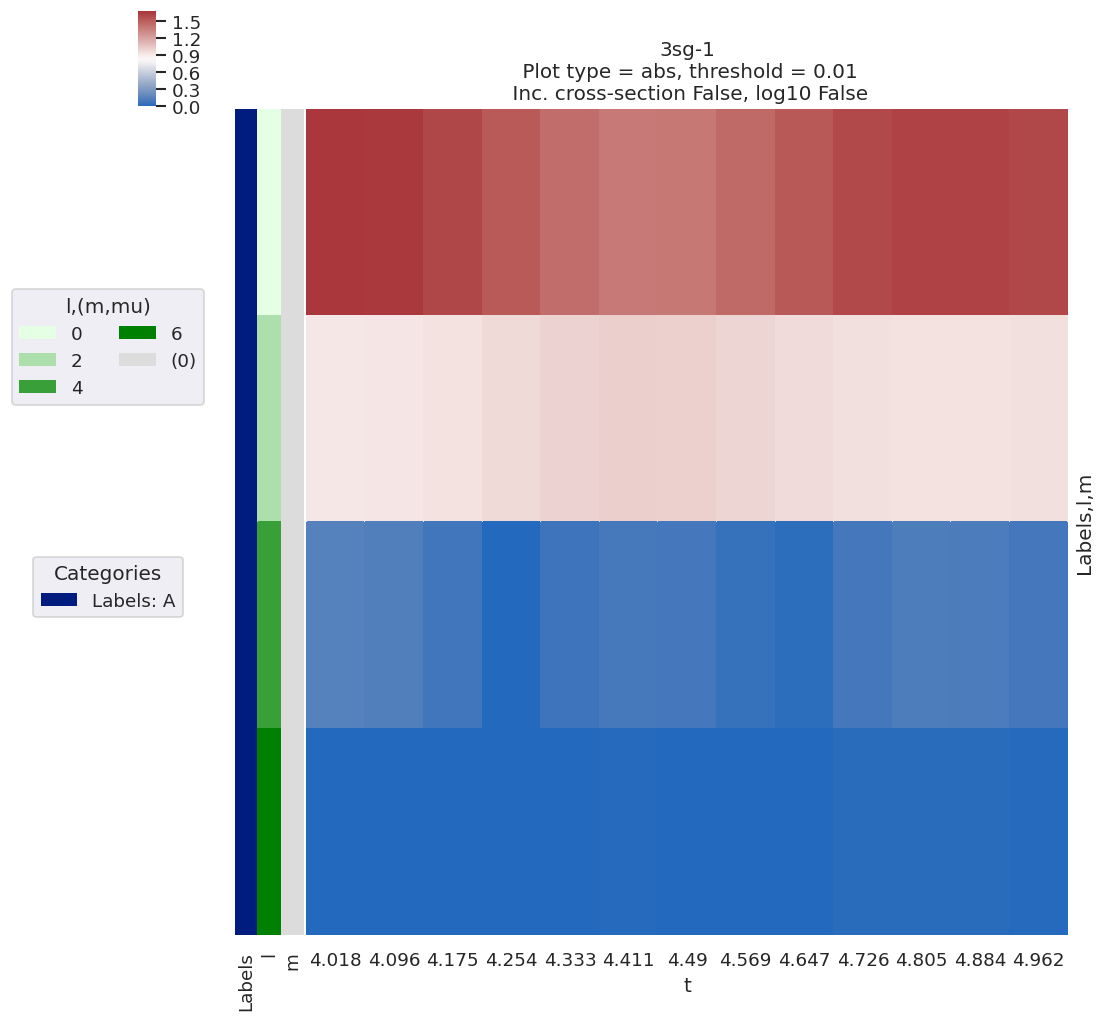
# Plot results with lmPlot wrapper - this also defaults to show data subset + most recent fit results
data.lmPlotFit()
Plotting data n2_3sg_0.1-50.1eV_A2.inp.out, pType=a, thres=0.01, with Seaborn
Fitting with randomised parameter inputs
Here we might expect some variation in the results, depending on various properites (ionizing channel, dataset size etc.), and also for the fitting to take a bit longer (see benchmarks later).
TODO:
More careful analysis routines here, run vs. number of input points & test fiedelity.
Parallelize.
Variation over runs/general statistical analysis.
[40]:
# Basic randomize routine, [0,1] interval
data.randomizeParams()
[41]:
data.fit()
# data.data[data.fitInd]['results']
data.result
[41]:
Fit Statistics
| fitting method | leastsq | |
| # function evals | 125 | |
| # data points | 195 | |
| # variables | 7 | |
| chi-square | 1.3656e-04 | |
| reduced chi-square | 7.2641e-07 | |
| Akaike info crit. | -2749.48342 | |
| Bayesian info crit. | -2726.57242 |
Variables
| name | value | standard error | relative error | initial value | min | max | vary | expression |
|---|---|---|---|---|---|---|---|---|
| m_PU_SG_PU_1_n1_1_1 | 1.58289130 | 0.00349661 | (0.22%) | 0.7734730444551108 | 1.0000e-04 | 5.00000000 | True | |
| m_PU_SG_PU_1_1_n1_1 | 1.58289130 | 0.00349661 | (0.22%) | 0.7734730444551108 | 1.0000e-04 | 5.00000000 | False | m_PU_SG_PU_1_n1_1_1 |
| m_PU_SG_PU_3_n1_1_1 | 1.15075599 | 0.00504342 | (0.44%) | 0.9055505085164982 | 1.0000e-04 | 5.00000000 | True | |
| m_PU_SG_PU_3_1_n1_1 | 1.15075599 | 0.00504342 | (0.44%) | 0.9055505085164982 | 1.0000e-04 | 5.00000000 | False | m_PU_SG_PU_3_n1_1_1 |
| m_SU_SG_SU_1_0_0_1 | 2.71014360 | 0.00229950 | (0.08%) | 0.4958500079092907 | 1.0000e-04 | 5.00000000 | True | |
| m_SU_SG_SU_3_0_0_1 | 1.04870550 | 0.00549518 | (0.52%) | 0.09347697515511166 | 1.0000e-04 | 5.00000000 | True | |
| p_PU_SG_PU_1_n1_1_1 | -0.86104140 | 0.00000000 | (0.00%) | -0.8610414024232179 | -3.14159265 | 3.14159265 | False | |
| p_PU_SG_PU_1_1_n1_1 | -0.86104140 | 0.00000000 | (0.00%) | -0.8610414024232179 | -3.14159265 | 3.14159265 | False | p_PU_SG_PU_1_n1_1_1 |
| p_PU_SG_PU_3_n1_1_1 | 3.10637670 | 0.00734675 | (0.24%) | 0.56091776181836 | -3.14159265 | 3.14159265 | True | |
| p_PU_SG_PU_3_1_n1_1 | 3.10637670 | 0.00734675 | (0.24%) | 0.56091776181836 | -3.14159265 | 3.14159265 | False | p_PU_SG_PU_3_n1_1_1 |
| p_SU_SG_SU_1_0_0_1 | 1.91102352 | 0.01049146 | (0.55%) | 0.7248080716178364 | -3.14159265 | 3.14159265 | True | |
| p_SU_SG_SU_3_0_0_1 | -1.18069117 | 0.02696050 | (2.28%) | 0.9781378176969566 | -3.14159265 | 3.14159265 | True |
Correlations (unreported correlations are < 0.100)
| m_PU_SG_PU_1_n1_1_1 | m_PU_SG_PU_3_n1_1_1 | -0.9335 |
| m_PU_SG_PU_1_n1_1_1 | p_SU_SG_SU_3_0_0_1 | -0.8395 |
| m_PU_SG_PU_3_n1_1_1 | p_SU_SG_SU_3_0_0_1 | 0.8196 |
| m_SU_SG_SU_1_0_0_1 | m_SU_SG_SU_3_0_0_1 | -0.8135 |
| p_PU_SG_PU_3_n1_1_1 | p_SU_SG_SU_1_0_0_1 | 0.7566 |
| m_SU_SG_SU_1_0_0_1 | p_PU_SG_PU_3_n1_1_1 | -0.5612 |
| m_PU_SG_PU_1_n1_1_1 | p_SU_SG_SU_1_0_0_1 | 0.5296 |
| m_SU_SG_SU_1_0_0_1 | p_SU_SG_SU_3_0_0_1 | -0.4552 |
| m_SU_SG_SU_3_0_0_1 | p_SU_SG_SU_3_0_0_1 | 0.4539 |
| m_SU_SG_SU_3_0_0_1 | p_PU_SG_PU_3_n1_1_1 | 0.4215 |
| m_PU_SG_PU_3_n1_1_1 | m_SU_SG_SU_1_0_0_1 | -0.3861 |
| m_PU_SG_PU_3_n1_1_1 | p_SU_SG_SU_1_0_0_1 | -0.3826 |
| m_PU_SG_PU_1_n1_1_1 | p_PU_SG_PU_3_n1_1_1 | 0.3701 |
| m_PU_SG_PU_1_n1_1_1 | m_SU_SG_SU_3_0_0_1 | -0.3225 |
| m_PU_SG_PU_1_n1_1_1 | m_SU_SG_SU_1_0_0_1 | 0.2572 |
| m_PU_SG_PU_3_n1_1_1 | p_PU_SG_PU_3_n1_1_1 | -0.2473 |
| m_PU_SG_PU_3_n1_1_1 | m_SU_SG_SU_3_0_0_1 | 0.2413 |
| m_SU_SG_SU_1_0_0_1 | p_SU_SG_SU_1_0_0_1 | -0.1668 |
[42]:
# Note that if keys is not set, BLMfitPlot will show all fit run results.
data.BLMfitPlot()
Dataset: subset, AFBLM
Dataset: 0, AFBLM
Setting parameter relations/constraints
If we know that some of the matrix elements (parameters) are related, this can be set using contraints on the parameters.
In this test case, we know some terms are equal… this should speed up the fitting, and also improve fiedelity.
UPDATE Aug 2022: note that constraints are now set automatically by self.setMatEFit() if working from known matrix elements. This can be overridden and/or set manually if desired.
[43]:
# With auto constraints - this is the default case
data.setMatEFit(paramsCons = 'auto')
Set 6 complex matrix elements to 12 fitting params, see self.params for details.
C:\Users\femtolab\.conda\envs\ePSdev\lib\site-packages\pandas\core\generic.py:3939: SettingWithCopyWarning:
A value is trying to be set on a copy of a slice from a DataFrame
See the caveats in the documentation: https://pandas.pydata.org/pandas-docs/stable/user_guide/indexing.html#returning-a-view-versus-a-copy
self._update_inplace(obj)
Auto-setting parameters.
| name | value | initial value | min | max | vary | expression |
|---|---|---|---|---|---|---|
| m_PU_SG_PU_1_n1_1_1 | 1.78461575 | 1.784615753610107 | 1.0000e-04 | 5.00000000 | True | |
| m_PU_SG_PU_1_1_n1_1 | 1.78461575 | 1.784615753610107 | 1.0000e-04 | 5.00000000 | False | m_PU_SG_PU_1_n1_1_1 |
| m_PU_SG_PU_3_n1_1_1 | 0.80290495 | 0.802904951323892 | 1.0000e-04 | 5.00000000 | True | |
| m_PU_SG_PU_3_1_n1_1 | 0.80290495 | 0.802904951323892 | 1.0000e-04 | 5.00000000 | False | m_PU_SG_PU_3_n1_1_1 |
| m_SU_SG_SU_1_0_0_1 | 2.68606212 | 2.686062120382649 | 1.0000e-04 | 5.00000000 | True | |
| m_SU_SG_SU_3_0_0_1 | 1.10915311 | 1.109153108617096 | 1.0000e-04 | 5.00000000 | True | |
| p_PU_SG_PU_1_n1_1_1 | -0.86104140 | -0.8610414024232179 | -3.14159265 | 3.14159265 | False | |
| p_PU_SG_PU_1_1_n1_1 | -0.86104140 | -0.8610414024232179 | -3.14159265 | 3.14159265 | False | p_PU_SG_PU_1_n1_1_1 |
| p_PU_SG_PU_3_n1_1_1 | -3.12044446 | -3.1204444620772467 | -3.14159265 | 3.14159265 | True | |
| p_PU_SG_PU_3_1_n1_1 | -3.12044446 | -3.1204444620772467 | -3.14159265 | 3.14159265 | False | p_PU_SG_PU_3_n1_1_1 |
| p_SU_SG_SU_1_0_0_1 | 2.61122920 | 2.611229196458127 | -3.14159265 | 3.14159265 | True | |
| p_SU_SG_SU_3_0_0_1 | -0.07867828 | -0.07867827542158025 | -3.14159265 | 3.14159265 | True |
[44]:
# With NO constraints set (except a reference phase)
data.setMatEFit(paramsCons = None)
Set 6 complex matrix elements to 12 fitting params, see self.params for details.
| name | value | initial value | min | max | vary |
|---|---|---|---|---|---|
| m_PU_SG_PU_1_n1_1_1 | 1.78461575 | 1.784615753610107 | 1.0000e-04 | 5.00000000 | True |
| m_PU_SG_PU_1_1_n1_1 | 1.78461575 | 1.784615753610107 | 1.0000e-04 | 5.00000000 | True |
| m_PU_SG_PU_3_n1_1_1 | 0.80290495 | 0.802904951323892 | 1.0000e-04 | 5.00000000 | True |
| m_PU_SG_PU_3_1_n1_1 | 0.80290495 | 0.802904951323892 | 1.0000e-04 | 5.00000000 | True |
| m_SU_SG_SU_1_0_0_1 | 2.68606212 | 2.686062120382649 | 1.0000e-04 | 5.00000000 | True |
| m_SU_SG_SU_3_0_0_1 | 1.10915311 | 1.109153108617096 | 1.0000e-04 | 5.00000000 | True |
| p_PU_SG_PU_1_n1_1_1 | -0.86104140 | -0.8610414024232179 | -3.14159265 | 3.14159265 | False |
| p_PU_SG_PU_1_1_n1_1 | -0.86104140 | -0.8610414024232179 | -3.14159265 | 3.14159265 | True |
| p_PU_SG_PU_3_n1_1_1 | -3.12044446 | -3.1204444620772467 | -3.14159265 | 3.14159265 | True |
| p_PU_SG_PU_3_1_n1_1 | -3.12044446 | -3.1204444620772467 | -3.14159265 | 3.14159265 | True |
| p_SU_SG_SU_1_0_0_1 | 2.61122920 | 2.611229196458127 | -3.14159265 | 3.14159265 | True |
| p_SU_SG_SU_3_0_0_1 | -0.07867828 | -0.07867827542158025 | -3.14159265 | 3.14159265 | True |
[45]:
# With manual constraints
# Set param constraints as dict
paramsCons = {}
paramsCons['m_PU_SG_PU_1_n1_1_1'] = 'm_PU_SG_PU_1_1_n1_1'
paramsCons['p_PU_SG_PU_1_n1_1_1'] = 'p_PU_SG_PU_1_1_n1_1'
paramsCons['m_PU_SG_PU_3_n1_1_1'] = 'm_PU_SG_PU_3_1_n1_1'
paramsCons['p_PU_SG_PU_3_n1_1_1'] = 'p_PU_SG_PU_3_1_n1_1'
# Missing settings will generate an error message
paramsCons['test'] = 'p_PU_SG_PU_3_1_n1_1'
data.setMatEFit(paramsCons = paramsCons)
Set 6 complex matrix elements to 12 fitting params, see self.params for details.
*** Warning, parameter test not present, skipping constraint test = p_PU_SG_PU_3_1_n1_1
| name | value | initial value | min | max | vary | expression |
|---|---|---|---|---|---|---|
| m_PU_SG_PU_1_n1_1_1 | 1.78461575 | 1.784615753610107 | 1.0000e-04 | 5.00000000 | False | m_PU_SG_PU_1_1_n1_1 |
| m_PU_SG_PU_1_1_n1_1 | 1.78461575 | 1.784615753610107 | 1.0000e-04 | 5.00000000 | True | |
| m_PU_SG_PU_3_n1_1_1 | 0.80290495 | 0.802904951323892 | 1.0000e-04 | 5.00000000 | False | m_PU_SG_PU_3_1_n1_1 |
| m_PU_SG_PU_3_1_n1_1 | 0.80290495 | 0.802904951323892 | 1.0000e-04 | 5.00000000 | True | |
| m_SU_SG_SU_1_0_0_1 | 2.68606212 | 2.686062120382649 | 1.0000e-04 | 5.00000000 | True | |
| m_SU_SG_SU_3_0_0_1 | 1.10915311 | 1.109153108617096 | 1.0000e-04 | 5.00000000 | True | |
| p_PU_SG_PU_1_n1_1_1 | -0.86104140 | -0.8610414024232179 | -3.14159265 | 3.14159265 | False | p_PU_SG_PU_1_1_n1_1 |
| p_PU_SG_PU_1_1_n1_1 | -0.86104140 | -0.8610414024232179 | -3.14159265 | 3.14159265 | True | |
| p_PU_SG_PU_3_n1_1_1 | -3.12044446 | -3.1204444620772467 | -3.14159265 | 3.14159265 | False | p_PU_SG_PU_3_1_n1_1 |
| p_PU_SG_PU_3_1_n1_1 | -3.12044446 | -3.1204444620772467 | -3.14159265 | 3.14159265 | True | |
| p_SU_SG_SU_1_0_0_1 | 2.61122920 | 2.611229196458127 | -3.14159265 | 3.14159265 | True | |
| p_SU_SG_SU_3_0_0_1 | -0.07867828 | -0.07867827542158025 | -3.14159265 | 3.14159265 | True |
[46]:
data.randomizeParams()
data.fit()
data.result
[46]:
Fit Statistics
| fitting method | leastsq | |
| # function evals | 96 | |
| # data points | 195 | |
| # variables | 8 | |
| chi-square | 2.6727e-21 | |
| reduced chi-square | 1.4292e-23 | |
| Akaike info crit. | -10249.6189 | |
| Bayesian info crit. | -10223.4349 |
Variables
| name | value | standard error | relative error | initial value | min | max | vary | expression |
|---|---|---|---|---|---|---|---|---|
| m_PU_SG_PU_1_n1_1_1 | 1.78461575 | 2.3225e-11 | (0.00%) | 0.4918447108209554 | 1.0000e-04 | 5.00000000 | False | m_PU_SG_PU_1_1_n1_1 |
| m_PU_SG_PU_1_1_n1_1 | 1.78461575 | 2.3225e-11 | (0.00%) | 0.4918447108209554 | 1.0000e-04 | 5.00000000 | True | |
| m_PU_SG_PU_3_n1_1_1 | 0.80290495 | 5.2373e-11 | (0.00%) | 0.8037810694070529 | 1.0000e-04 | 5.00000000 | False | m_PU_SG_PU_3_1_n1_1 |
| m_PU_SG_PU_3_1_n1_1 | 0.80290495 | 5.2373e-11 | (0.00%) | 0.8037810694070529 | 1.0000e-04 | 5.00000000 | True | |
| m_SU_SG_SU_1_0_0_1 | 2.68606212 | 3.8799e-11 | (0.00%) | 0.4066560593046321 | 1.0000e-04 | 5.00000000 | True | |
| m_SU_SG_SU_3_0_0_1 | 1.10915311 | 9.3949e-11 | (0.00%) | 0.985108986693152 | 1.0000e-04 | 5.00000000 | True | |
| p_PU_SG_PU_1_n1_1_1 | 0.02577097 | 6.7941e-11 | (0.00%) | 0.21748372580578446 | -3.14159265 | 3.14159265 | False | p_PU_SG_PU_1_1_n1_1 |
| p_PU_SG_PU_1_1_n1_1 | 0.02577097 | 6.7941e-11 | (0.00%) | 0.21748372580578446 | -3.14159265 | 3.14159265 | True | |
| p_PU_SG_PU_3_n1_1_1 | 2.28517403 | 9.7670e-11 | (0.00%) | 0.8392208350941387 | -3.14159265 | 3.14159265 | False | p_PU_SG_PU_3_1_n1_1 |
| p_PU_SG_PU_3_1_n1_1 | 2.28517403 | 9.7670e-11 | (0.00%) | 0.8392208350941387 | -3.14159265 | 3.14159265 | True | |
| p_SU_SG_SU_1_0_0_1 | 2.83668567 | 3.1654e-11 | (0.00%) | 0.7600423544174237 | -3.14159265 | 3.14159265 | True | |
| p_SU_SG_SU_3_0_0_1 | -0.75659216 | 1.0703e-10 | (0.00%) | 0.8146627590476676 | -3.14159265 | 3.14159265 | True |
Correlations (unreported correlations are < 0.100)
| m_SU_SG_SU_1_0_0_1 | m_SU_SG_SU_3_0_0_1 | -0.9877 |
| m_PU_SG_PU_1_1_n1_1 | m_PU_SG_PU_3_1_n1_1 | -0.9757 |
| m_PU_SG_PU_1_1_n1_1 | p_PU_SG_PU_1_1_n1_1 | -0.9608 |
| m_PU_SG_PU_3_1_n1_1 | p_PU_SG_PU_1_1_n1_1 | 0.9354 |
| p_PU_SG_PU_1_1_n1_1 | p_PU_SG_PU_3_1_n1_1 | -0.9334 |
| m_SU_SG_SU_3_0_0_1 | p_SU_SG_SU_3_0_0_1 | -0.9015 |
| m_SU_SG_SU_1_0_0_1 | p_SU_SG_SU_3_0_0_1 | 0.8910 |
| m_PU_SG_PU_3_1_n1_1 | p_PU_SG_PU_3_1_n1_1 | -0.8892 |
| m_PU_SG_PU_1_1_n1_1 | p_PU_SG_PU_3_1_n1_1 | 0.8832 |
| p_SU_SG_SU_1_0_0_1 | p_SU_SG_SU_3_0_0_1 | 0.7961 |
| m_SU_SG_SU_1_0_0_1 | p_SU_SG_SU_1_0_0_1 | 0.7425 |
| m_SU_SG_SU_3_0_0_1 | p_SU_SG_SU_1_0_0_1 | -0.7277 |
| p_PU_SG_PU_1_1_n1_1 | p_SU_SG_SU_1_0_0_1 | 0.6140 |
| p_PU_SG_PU_3_1_n1_1 | p_SU_SG_SU_1_0_0_1 | -0.5996 |
| m_PU_SG_PU_1_1_n1_1 | p_SU_SG_SU_1_0_0_1 | -0.4737 |
| m_PU_SG_PU_3_1_n1_1 | p_SU_SG_SU_1_0_0_1 | 0.4491 |
| p_PU_SG_PU_3_1_n1_1 | p_SU_SG_SU_3_0_0_1 | -0.2486 |
| m_SU_SG_SU_3_0_0_1 | p_PU_SG_PU_3_1_n1_1 | 0.1582 |
| m_SU_SG_SU_1_0_0_1 | p_PU_SG_PU_3_1_n1_1 | -0.1457 |
| p_PU_SG_PU_1_1_n1_1 | p_SU_SG_SU_3_0_0_1 | 0.1352 |
| m_SU_SG_SU_1_0_0_1 | p_PU_SG_PU_1_1_n1_1 | 0.1348 |
| m_PU_SG_PU_3_1_n1_1 | m_SU_SG_SU_3_0_0_1 | -0.1335 |
| m_SU_SG_SU_3_0_0_1 | p_PU_SG_PU_1_1_n1_1 | -0.1265 |
| m_PU_SG_PU_1_1_n1_1 | m_SU_SG_SU_1_0_0_1 | -0.1240 |
| m_PU_SG_PU_1_1_n1_1 | m_SU_SG_SU_3_0_0_1 | 0.1172 |
| m_PU_SG_PU_3_1_n1_1 | m_SU_SG_SU_1_0_0_1 | 0.1076 |
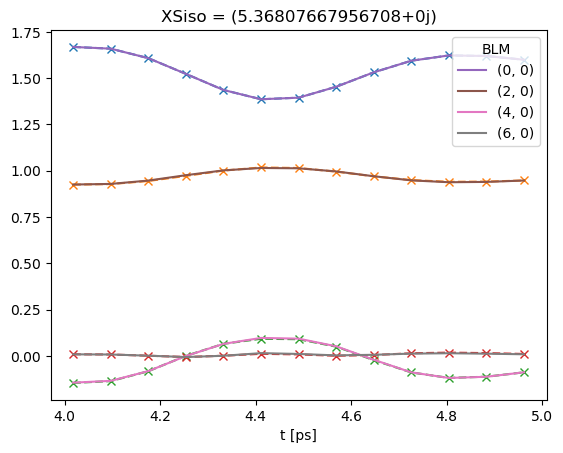
[47]:
# Note that if keys is not set, BLMfitPlot will show only most recent fit run results.
data.BLMfitPlot()
Dataset: subset, AFBLM
Dataset: 1, AFBLM
Quick benchmarks
Timing for the test fit (next cell) - note this is currently just running with defaults, single core only, and we’re not checking for good fiedelity here. Fits take between 1 and 12 mins, approximately.
Results may vary depending on the inputs… for the current test case:
1st test The slowest run took 12.88 times longer than the fastest. This could mean that an intermediate result is being cached. 50.7 s ± 1min 2s per loop (mean ± std. dev. of 7 runs, 1 loop each)
2nd test The slowest run took 105.38 times longer than the fastest. This could mean that an intermediate result is being cached. 4min 13s ± 7min 6s per loop (mean ± std. dev. of 7 runs, 1 loop each)
TODO:
More careful testing & benchmarks.
Timing vs. input dataset size.
Fitting statistics over fits (fidelity vs. fit vs. dataset size etc.).
[48]:
# %%timeit
# # With NO constraints set (except a reference phase)
# data.setMatEFit(paramsCons = None)
# data.randomizeParams()
# data.fit()
Timing for the test fit (next cell, same method as earlier) - note this is currently just running with defaults, single core only, and we’re not checking for good fiedelity here. Note, also, that these results are in the ~10s range, compared to ~many minutes for the unconstrained case.
1st test 10.7 s ± 2.86 s per loop (mean ± std. dev. of 7 runs, 1 loop each)
2nd test 7.9 s ± 3.5 s per loop (mean ± std. dev. of 7 runs, 1 loop each)
[49]:
%%timeit
data.randomizeParams()
data.fit()
The slowest run took 4.27 times longer than the fastest. This could mean that an intermediate result is being cached.
13.1 s ± 6.31 s per loop (mean ± std. dev. of 7 runs, 1 loop each)
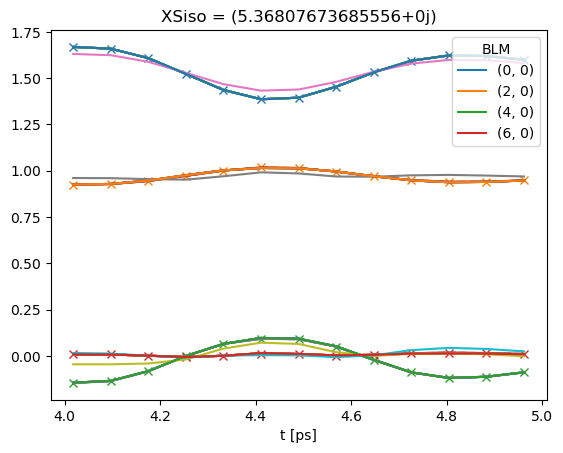
[50]:
# Plot multiple fit sets
# Note that if keys = 'all' is set, BLMfitPlot will show ALL fit run results.
# TODO: use Seaborn/HV for better plotting here!
data.BLMfitPlot(keys = 'all')
Dataset: subset, AFBLM
Dataset: 0, AFBLM
Dataset: 1, AFBLM
Dataset: 2, AFBLM
Dataset: 3, AFBLM
Dataset: 4, AFBLM
Dataset: 5, AFBLM
Dataset: 6, AFBLM
Dataset: 7, AFBLM
Dataset: 8, AFBLM
Dataset: 9, AFBLM
Versions
[51]:
import scooby
scooby.Report(additional=['epsproc', 'pemtk', 'xarray', 'jupyter'])
[51]:
| Fri Sep 02 10:15:40 2022 Eastern Daylight Time | |||||
| OS | Windows | CPU(s) | 32 | Machine | AMD64 |
| Architecture | 64bit | RAM | 63.9 GB | Environment | Jupyter |
| Python 3.7.3 (default, Apr 24 2019, 15:29:51) [MSC v.1915 64 bit (AMD64)] | |||||
| epsproc | 1.3.2-dev | pemtk | 0.0.1 | xarray | 0.15.0 |
| jupyter | Version unknown | numpy | 1.18.1 | scipy | 1.3.0 |
| IPython | 7.12.0 | matplotlib | 3.3.1 | scooby | 0.5.6 |
| Intel(R) Math Kernel Library Version 2020.0.0 Product Build 20191125 for Intel(R) 64 architecture applications | |||||
[52]:
# Check current Git commit for local ePSproc version
!git -C {Path(ep.__file__).parent} branch
!git -C {Path(ep.__file__).parent} log --format="%H" -n 1
* dev
master
numba-tests
815a839f3c8c4995532d6b5f87997b8ba2bb12eb
[53]:
# Check current remote commits
!git ls-remote --heads https://github.com/phockett/ePSproc
# !git ls-remote --heads git://github.com/phockett/epsman
92c661789a7d2927f2b53d7266f57de70b3834fa refs/heads/dependabot/pip/notes/envs/envs-versioned/mistune-2.0.3
fe1e9540c7b91fe571f60562acd31d8e489d491e refs/heads/dependabot/pip/notes/envs/envs-versioned/nbconvert-6.5.1
815a839f3c8c4995532d6b5f87997b8ba2bb12eb refs/heads/dev
1c0b8fd409648f07c85f4f20628b5ea7627e0c4e refs/heads/master
69cd89ce5bc0ad6d465a4bd8df6fba15d3fd1aee refs/heads/numba-tests
ea30878c842f09d525fbf39fa269fa2302a13b57 refs/heads/revert-9-master
[54]:
# Check current Git commit for local PEMtk version
import pemtk
!git -C {Path(pemtk.__file__).parent} branch
!git -C {Path(pemtk.__file__).parent} log --format="%H" -n 1
master
* mfFittingDev
c1be71d7cbb7d000370d9d28dbeaaca48b9e8bb0
[55]:
# Check current remote commits
!git ls-remote --heads https://github.com/phockett/PEMtk
# !git ls-remote --heads git://github.com/phockett/epsman
1059c4ebbd637467c0b6c37a95a51b684be0d298 refs/heads/master
7eda41b192a0b9a214bef2925becc99f716bf59a refs/heads/mfFittingDev
[ ]: